To Noobs with Love: Machine Learning: Multiple Linear Regression
- Savidu Dias

- Mar 23, 2020
- 3 min read
In my first blog post, I discussed Simple Linear Regression. Unlike Simple Linear Regression, Multiple Linear Regression can have more than one independent variable. The goal of Multiple Linear Regression is to model the linear relationship between multiple independent variables and the dependent variable.
The formula for Multiple Linear Regression is:

Example Using Multiple Linear Regression
For example, an investor may want to know the correlation between profits made by a startup with its expenses. In this case, an analyst might create a linear equation with the profit as the independent variable, and multiple other factors as independent variables.
There are multiple expenses that predict the profit made by the business. For example, expenses such as R&D spending, administration, and marketing may contribute to the final profit outcome. To understand the relationship in which two or more variables are present, multiple linear regression is used.

Referring to the Multiple Linear Regression equation above from our example:
b1, b2, and b3 refers to regression coefficients that measure the unit change in the dependent variables when the value of an independent variable changes. b0 refers to the constant of the linear equation.
Categorical Data and Dummy Variables
Imagine that our investor is now interested in expanding globally and wants to know the profit performances of different companies in international markets, keeping the same independent variables.

Now we are introduced with a new column in our dataset called “region”. Unlike the other columns, you will notice that the values for the region (North America and Europe) are not numeric values. The values for the region are known as categorical variables.
How do we represent categorical variables in our equation?
The approach we should take when we get categorical variables in regression models is to create dummy variables. This is how we make dummy variables.
First, we must go through our column and take note of the different categories that we have. In our example, we have two categories; North America and Europe.
Create a new column for each category that we find.
Populate the new columns.

Populating columns is done by getting the rows where we have North America as the region, and put 1 under the North America column for those rows, and 0 for the other rows. Same rules are followed for the Europe column. The new columns that we made are called dummy variables.

Building our regression model from here is very simple. All we have to do is use the North America and Europe column instead of the Region column. You will notice that we have included the dummy variable for North America in our equation, but not Europe.
Why is there a coefficient for North America, but not Europe?
This is not biased. Regression models will take the dummy variable which is not included, and set that as the default state of the equation. That means the coefficient for Europe will be included in the constant b0.
Dummy Variable Trap
What will happen if we include the dummy variable for Europe in our model?

The dummy variables in our equation are independent variables. We can see that there is a relationship between the dummy variables D1 and D2 where D2 = 1 - D1.
When one or more independent variables can predict another independent variable in a linear regression, this phenomenon is called multicollinearity. Multicollinearity can lead to misleading results when attempting to determine how well each independent variable can be used most effectively to predict the dependent variable in a regression model.
Our model cannot distinguish the effects of D1 from the effects of D2. Therefore, it will produce skewed results. This is called a dummy variable trap.
Multiple Categories
What if there are more categories for our region in the dataset? Imagine having more regions.

The number of dummy variables used per categorical variable set will be n -1, where n is the number of categories. If we have 4 categories, the number of dummy variables will be 3.
The dummy variable for Australia is not included in the equation. Therefore, the equation where all dummy variables are zero will be the equation for Australia.
Multiple Categorical Variables
Our investor now wants to be more specific when it comes to profits earned through spending by categorizing data per industry. We are given a new dataset with an additional column for industry.
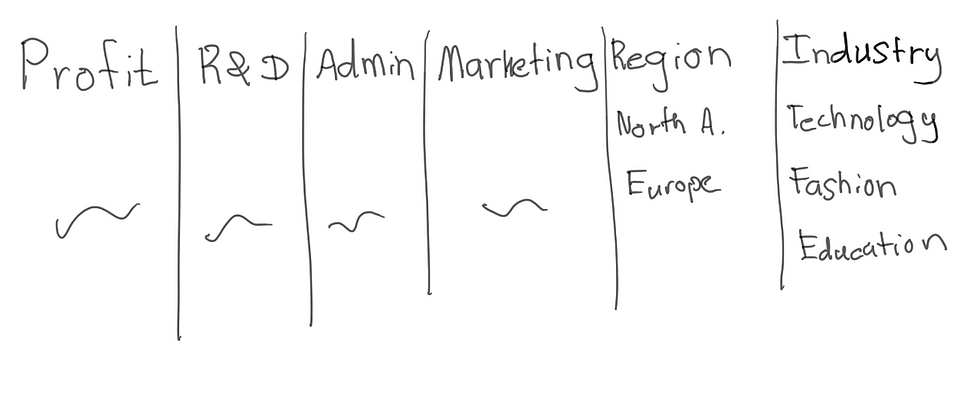
In this dataset, we have two categories for the region, and three categories for Industry.

We can recreate our dataset with dummy variables as shown above.
We will have a column for the North America region. Zero values in this column represent states where the region is Europe.
Two columns for technology and fashion categories. The education category will be represented when the values for both technology and fashion are zero.

Comments